GUIDE ME

Masters in Data Analytics Fee | No-Cost EMI

EMI with 0% interest and
0 down payment

Starting at

INR 6666* Per Month

Register Now
And Get

10%

OFF

Limited Time Offer*

Masters in Data Analytics  Curriculum

Course Module

    What is Data Analytic

    Common Terms in Data Analytics

    What is data

    Classication of data

    Relevance in industry and need of the hour

    Types of problems and business objectives in various industries

    How leading companies are harnessing the power of analytics

    Critical success drivers.

    Overview of Data Analytics tools & their popularity.

    Data Analytics Methodology & problem-solving framework.

    List of steps in Data Analytics projects

    Introduction To Python

    • Installation and Working with Python
    • Understanding Python variables
    • Python basic Operators
    • Understanding the Python blocks.

    Python Keyword and Identiers

    • Python Comments, Multiline Comments.
    • Python Indentation
    • Understating the concepts of Operators
      • Arithmetic
      • Relational
      • Logical
      • Assignment
      • Membership
      • Identity

    Introduction To Variables

    • Variables, expression condition and function
    • Global and Local Variables in Python
    • Packing and Unpacking Arguments
    • Type Casting in Python
    • Byte objects vs. string in Python
    • Variable Scope

    Python Data Type

    • Declaring and using Numeric data types
    • Using string data type and string operations
    • Understanding Non-numeric data types
    • Understanding the concept of Casting and Boolean.
    • Strings
    • List
    • Tuples
    • Dictionary
    • Sets

    Control Structure & Flow

    • Statements ? if, else, elif
    • How to use nested IF and Else in Python
    • Loops
    • Loops and Control Statements.
    • Jumping Statements ? Break, Continue, pass
    • Looping techniques in Python
    • How to use Range function in Loop
    • Programs for printing Patterns in Python
    • How to use if and else with Loop
    • Use of Switch Function in Loop
    • Elegant way of Python Iteration
    • Generator in Python
    • How to use nested Loop in Python
    • Use If and Else in for and While Loop
    • Examples of Looping with Break and Continue Statement
    • How to use IN or NOT IN keyword in Python Loop.

    Python Function, Modules and Packages

    • Python Syntax
    • Function Call
    • Return Statement
    • Arguments in a function ? Required, Default, Positional, Variable-length
    • Write an Empty Function in Python ?pass statement.
    • Lamda/ Anonymous Function
    • *args and **kwargs
    • Help function in Python
    • Scope and Life Time of Variable in Python Function
    • Nested Loop in Python Function
    • Recursive Function and Its Advantage and Disadvantage
    • Organizing python codes using functions
    • Organizing python projects into modules
    • Importing own module as well as external modules
    • Understanding Packages
    • Random functions in python
    • Programming using functions, modules & external packages
    • Map, Filter and Reduce function with Lambda Function
    • More example of Python Function

    List

    • What is List.
    • List Creation
    • List Length
    • List Append
    • List Insert
    • List Remove
    • List Append & Extend using ?+? and Keyword
    • List Delete
    • List related Keyword in Python
    • List Revers
    • List Sorting
    • List having Multiple Reference
    • String Split to create a List
    • List Indexing
    • List Slicing
    • List count and Looping
    • List Comprehension and Nested Comprehension

    Tuple

    • What is Tuple
    • Tuple Creation
    • Accessing Elements in Tuple
    • Changing a Tuple
    • Tuple Deletion
    • Tuple Count
    • Tuple Index
    • Tuple Membership
    • TupleBuilt in Function (Length, Sort)

    Dictionary

    • Dict Creation
    • Dict Access (Accessing Dict Values)
    • Dict Get Method
    • Dict Add or Modify Elements
    • Dict Copy
    • Dict From Keys.
    • Dict Items
    • Dict Keys (Updating, Removing and Iterating)
    • Dict Values
    • Dict Comprehension
    • Default Dictionaries
    • Ordered Dictionaries
    • Looping Dictionaries
    • Dict useful methods (Pop, Pop Item, Str , Update etc.)

    Sets

    • What is Set
    • Set Creation
    • Add element to a Set
    • Remove elements from a Set
    • PythonSet Operations
    • Frozen Sets

    Strings

    • What is Set
    • Set Creation
    • Add element to a Set
    • Remove elements from a Set
    • PythonSet Operations

    Python Exception Handling

    • Python Errors and Built-in-Exceptions
    • Exception handing Try, Except and Finally
    • Catching Exceptions in Python
    • Catching Specic Exception in Python
    • Raising Exception
    • Try and Finally

    Python File Handling

    • Opening a File
    • Python File Modes
    • Closing File
    • Writing to a File
    • Reading from a File
    • Renaming and Deleting Files in Python
    • Python Directory and File Management
    • List Directories and Files
    • Making New Directory
    • Changing Directory

    Python Database Interaction

    • SQL Database connection using
    • Creating and searching tables
    • Reading and Storing cong information on database
    • Programming using database connections

    Reading an excel

    • Working With Excel
    • Reading an excel le using Python
    • Writing to an excel sheet using Python
    • Python| Reading an excel le
    • Python | Writing an excel le
    • Adjusting Rows and Column using Python
    • ArithmeticOperation in Excel le.
    • Play with Workbook, Sheets and Cells in Excel using Python
    • Creating and Removing Sheets
    • Formatting the Excel File Data
    • More example of Python Function

    Complete Understanding of OS Module of Python

    • Check Dirs. (exist or not)
    • How to split path and extension
    • How to get user prole detail
    • Get the path of Desktop, Documents, Downloads etc.
    • Handle the File System Organization using OS
    • How to get any les and folder?s details using OS

    Data Analysis and Visualization using Pandas.

    • Statistics
      • Categorical Data
      • Numerical Data
      • Mean
      • Median
      • Mode
      • Outliers
      • Range
      • Interquartile range
      • Correlation
      • Standard Deviation
      • Variance
      • Box plot
    • Pandas
      • Read data from Excel File using Pandas More Plotting, Date Time Indexing and writing to les
      • How to get record specic records Using Pandas Adding & Resetting Columns, Mapping with function
      • Using the Excel File class to read multiple sheets More Mapping, Filling Nonvalue?s
      • Exploring the Data Plotting, Correlations, and Histograms
      • Getting statistical information about the data Analysis Concepts, Handle the None Values
      • Reading les with no header and skipping records Cumulative Sums and Value Counts, Ranking etc
      • Reading a subset of columns Data Maintenance, Adding/Removing Cols and Rows
      • Applying formulas on the columns Basic Grouping, Concepts of Aggre gate Function
      • Complete Understanding of Pivot Table Data Slicing using iLoc and Loc property (Setting Indices)
      • Under sting the Properties of Pivot Table in Pandas Advanced Reading CSVs/HTML, Binning, Categorical Data
      • Exporting the results to Excel Joins
      • Python | Pandas Data Frame Inner Join
      • Under sting the properties of Data Frame Left Join (Left Outer Join)
      • Indexing and Selecting Data with Pandas Right Join (Right Outer Join)
      • Pandas | Merging, Joining and Concatenating Full Join (Full Outer Join)
      • Pandas | Find Missing Data and Fill and Drop NA Appending Data Frame and Data
      • Pandas | How to Group Data How to apply Lambda / Function on Data Frame
      • Other Very Useful concepts of Pandas in Python Data Time Property in Pandas (More and More)

    Data Analysis and Visualization using NumPy and MatPlotLib

    • NumPy
      • Introduction to NumPy Numerical Python
      • Importing NumPy and Its Properties
      • NumPy Arrays
      • Creating an Array from a CSV
      • Operations an Array from a CSV
      • Operations with NumPy Arrays
      • Two-Dimensional Array
      • Selecting Elements from 1-D Array
      • Selecting Elements from 2-D Array
      • Logical Operation with Arrays
      • Indexing NumPy elements using conditionals
      • NumPy?s Mean and Axis
      • NumPy?s Mode, Median and Sum Function
      • NumPy?s Sort Function and More
    • MatPlotLib
      • Bar Chart using Python MatPlotLib
      • Column Chart using Python MatPlotLib
      • Pie Chart using Python MatPlotLib
      • Area Chart using Python MatPlotLib
      • Scatter Plot Chart using Python MatPlotLib
      • Play with Charts Properties Using MatPlotLib
      • Export the Chart as Image
      • Understanding plt. subplots () notation
      • Legend Alignment of Chart using MatPlotLib
      • Create Charts as Image
      • Other Useful Properties of Charts.
      • Complete Understanding of Histograms
      • Plotting Different Charts, Labels, and Labels Alignment etc.

    Introduction to Data Visualization with Seaborn

    • Introduction to Seaborn
      • Introduction to Seaborn
      • Making a scatter plot with lists
      • Making a count plot with a list
      • Using Pandas with seaborn
      • Tidy vs Untidy data
      • Making a count plot with a Dataframe
      • Adding a third variable with hue
      • Hue and scattera plots
      • Hue and count plots
    • Visualizing Two Quantitative Variables
      • Introduction to relational plots and subplots
      • Creating subplots with col and row
      • Customizing scatters plots
      • Changing the size of scatter plot points
      • Changing the style of scatter plot points
      • Introduction to line plots
      • Interpreting line plots
      • Visualizing standard deviation with line plots
      • Plotting subgroups in line plots
    • Visualizing a Categorical and a Quantitative Variable
      • Current plots and bar plots
      • Count plots
      • Bar plot with percentages
      • Customizing bar plots
      • Box plots
      • Create and interpret a box plot
      • Omitting outliers
      • Adjusting the whisk
      • Point plots
      • Customizing points plots
      • Point plot with subgroups
    • Customizing Seaborn Plots
      • Changing plot style and colour
      • Changing style and palette
      • Changing the scale
      • Using a custom palette
      • Adding titles and labels Part 1
      • Face Grids vs. Axes Subplots
      • Adding a title to a face Grid object
      • Adding title and labels Part 2
      • Adding a title and axis labels
      • Rotating x-tics labels
      • Putting it all together
      • Box plot with subgroups
      • Bar plot with subgroups and subplots
      • Well done! What?s next

    Introduction to Statistics

    • Descriptive Statistics
    • Sample vs Population Statistics
    • Random variables
    • Probability distribution functions
    • Expected value
    • Normal distribution
    • Gaussian distribution
    • Z-score
    • Spread and Dispersion
    • Correlation and Co-variance

    Data Pre-Processing & Data Mining

    • Data Preparation
    • Feature Engineering
    • Feature Scaling
    • Datasets
    • Dimensionality Reduction
    • Anomaly Detection
    • Parameter Estimation
    • Data and Knowledge
    • Selected Applications in Data Mining

    EDA (Exploratory Data Analysis)

    • Need for structured exploratory data
    • EDA framework for exploring the data and identifying any problems with the data (Data Audit Report)
    • Identify missing data
    • Identify outliers? data
    • Imbalanced Data Techniques

    SQL Server Fundamentals

    • SQL Server 2019 Installation
    • Service Accounts & Use, Authentication Modes & Usage, Instance Congurations
    • SQL Server Features & Purpose
    • Using Management Studio (SSMS)
    • Conguration Tools & SQLCMD
    • Conventions & Collation

    SQL Server 2019 Database Design

    • SQL Database Architecture
    • Database Creation using GUI
    • Database Creation using T-SQL scripts
    • DB Design using Files and File Groups
    • File locations and Size parameters
    • Database Structure modications

    SQL Tables in MS SQL Server

    • SQL Server Database Tables
    • Table creation using T-SQL Scripts
    • Naming Conventions for Columns
    • Single Row and Multi-Row Inserts
    • Table Aliases
    • Column Aliases & Usage
    • Table creation using Schemas
    • Basic INSERT
    • UPDATE
    • DELETE
    • SELECT queries and Schemas
    • Use of WHERE, IN and BETWEEN
    • Variants of SELECT statement
    • ORDER BY
    • GROUPING
    • HAVING
    • ROWCOUNT and CUBE Functions

    Data Validation and Constraints

    • Table creation using Constraints
    • NULL and IDENTITY properties
    • UNIQUE KEY Constraint and NOT NULL
    • PRIMARY KEY Constraint & Usage
    • CHECK and DEFAULT Constraints
    • Naming Composite Primary Keys
    • Disabling Constraints & Other Options

    Views and Row Data Security

    • Benets of Views in SQL Database
    • Views on Tables and Views
    • SCHEMA BINDING and ENCRYPTION
    • Issues with Views and ALTER TABLE
    • Common System Views and Metadata
    • Common Dynamic Management views
    • Working with JOINS inside views

    Indexes and Query tuning

    • Need for Indexes & Usage
    • Indexing Table & View Columns
    • Index SCAN and SEEK
    • INCLUDED Indexes & Usage
    • Materializing Views (storage level)
    • Composite Indexed Columns & Keys
    • Indexes and Table Constraints
    • Primary Keys & Non-Clustered Indexes

    Stored Procedures and Benets

    • Why to use Stored Procedures
    • Types of Stored Procedures
    • Use of Variables and parameters
    • SCHEMABINDING and ENCRYPTION
    • INPUT and OUTPUT parameters
    • System level Stored Procedures
    • Dynamic SQL and parameterization

    System functions and Usage

    • Scalar Valued Functions
    • Types of Table Valued Functions
    • SCHEMABINDING and ENCRYPTION
    • System Functions and usage
    • Date Functions
    • Time Functions
    • String and Operational Functions
    • ROW_COUNT
    • GROUPING Functions

    Triggers, cursors, memory limitations

    • Why to use Triggers
    • DML Triggers and Performance impact
    • INSERTED and DELETED memory tables
    • Data Audit operations & Sampling
    • Database Triggers and Server Triggers
    • Bulk Operations with Triggers

    Cursors and Memory Limitations

    • Cursor declaration and Life cycle
    • STATIC
    • DYNAMIC
    • SCROLL Cursors
    • FORWARD_ONLY and LOCAL Cursors
    • KEYSET Cursors with Complex SPs

    Transactions Management

    • ACID Properties and Scope
    • EXPLICIT Transaction types
    • IMPLICIT Transactions and options
    • AUTOCOMMIT Transaction and usage

    Understanding Concepts of Excel

    • Creation of Excel Sheet Data
    • Range Name, Format Painter
    • Conditional Formatting, Wrap Text, Merge & Centre
    • Sort, Filter, Advance Filter
    • Different type of Chart Creations
    • Auditing, (Trace Precedents, Trace Dependents)Print Area
    • Data Validations, Consolidate, Subtotal
    • What if Analysis (Data Table, Goal Seek, Scenario)
    • Solver, Freeze Panes
    • Various Simple Functions in Excel(Sum, Average, Max, Min)
    • Real Life Assignment work

    Ms Excel Advance

    • Advance Data Sorting
    • Multi-level sorting
    • Restoring data to original order after performing sorting
    • Sort by icons
    • Sort by colours
    • Lookup Functions
      • Lookup
      • VLookup
      • HLookup
    • Subtotal, Multi-Level Subtotal
    • Grouping Features
      • Column Wise
      • Row Wise
    • Consolidation With Several Worksheets
    • Filter
      • Auto Filter
      • Advance Filter
    • Printing of Raw & Column Heading on Each Page
    • Workbook Protection and Worksheet Protection
    • Specified Range Protection in Worksheet
    • Excel Data Analysis
      • Goal Seek
      • Scenario Manager
    • Data Table
      • Advance use of Data Tables in Excel
      • Reporting and Information Representation
    • Pivot Table
      • Pivot Chat
      • Slicer with Pivot Table & Chart
    • Generating MIS Report In Excel
      • Advance Functions of Excel
      • Math & Trig Functions
    • Text Functions
    • Lookup & Reference Function
    • Logical Functions & Date and Time Functions
    • Database Functions
    • Statistical Functions
    • Financial Functions
    • Functions for Calculation Depreciation

    MIS Reporting & Dash Board

    • Dashboard Background
    • Dashboard Elements
    • Interactive Dashboards
    • Type of Reporting In India
      • Industry Related Dashboard
      • Indian Print Media Reporting

    What is Macro

    • Understanding Macros

    Recording a Macro

    • Recording a Macro

    Different Components of a Macro

    • User Form
    • Title
    • Module

    What is VBA and how to write macros in VBA.

    • Writing a simple macro
    • Apply arithmetic operations on two cells using macros.
    • How to align the text using macros.
    • How to change the background color of the cells using macros.
    • How to change the border color and style of the cells using macros.
    • Use cell referencing using macros.
    • How to copy the data from one cell and paste it into another.
    • How to change the font color of the text in a cell?using?macros

    Introduction to Power BI

    • Overview of BI concepts
    • Why we need BI
    • Introduction to SSBI
    • SSBI Tools
    • Why Power BI
    • What is Power BI
    • Building Blocks of Power BI
    • Getting started with Power BI Desktop
    • Get Power BI Tools
    • Introduction to Tools and Terminology
    • Dashboard in Minutes
    • Interacting with your Dashboards
    • Sharing Dashboards and Reports

    Power BI Desktop

    • Power BI Desktop
    • Extracting data from various sources
    • Workspaces in Power BI

    Power BI Data Transformation

    • Data Transformation
    • Query Editor
    • Connecting Power BI Desktop to our Data Sources
    • Editing Rows
    • Understanding Append Queries
    • Editing Columns
    • Replacing Values
    • Formatting Data
    • Pivoting and Unpivoting Columns
    • Splitting Columns
    • Creating a New Group for our Queries
    • Introducing the Star Schema
    • Duplicating and Referencing Queries
    • Creating the Dimension Tables
    • Entering Data Manually
    • Merging Queries
    • Finishing the Dimension Table
    • Introducing the another DimensionTable
    • Creating an Index Column
    • Duplicating Columns and Extracting Information
    • Creating Conditional Columns
    • Creating the FACT Table
    • Performing Basic Mathematical Operations
    • Improving Performance and Loading Data into the Data Model

    Modelling with Power BI

    • Introduction to Modelling
    • Modelling Data
    • Manage Data Relationship
    • Optimize Data Models
    • Cardinality and Cross Filtering
    • Default Summarization & Sort by
    • Creating Calculated Columns
    • Creating Measures & Quick Measures

    Data Analysis Expressions (DAX)

    • What is DAX
    • Data Types in DAX
    • Calculation Types
    • Syntax, Functions, Context Options
    • DAX Functions
      • Date and Time
      • Time Intelligence
      • Information
      • Logical
      • Mathematical
      • Statistical
      • Text and Aggregate
    • Measures in DAX
    • Measures and Calculated Columns
    • ROW Context and Filter Context in DAX
    • Operators in DAX - Real-time Usage
    • Quick Measures in DAX - Auto validations
    • In-Memory Processing DAX Performance

    Power BI Desktop Visualisations

    • How to use Visual in Power BI
    • What Are Custom Visuals
    • Creating Visualisations and Colour Formatting
    • Setting Sort Order
    • Scatter & Bubble Charts & Play Axis
    • Tooltips and Slicers, Timeline Slicers & Sync Slicers
    • Cross Filtering and Highlighting
    • Visual, Page and Report Level Filters
    • Drill Down/Up
    • Hierarchies and Reference/Constant Lines
    • Tables, Matrices & Conditional Formatting
    • KPI's, Cards & Gauges
    • Map Visualizations
    • Custom Visuals
    • Managing and Arranging
    • Drill through and Custom Report Themes
    • Grouping and Binning and Selection Pane, Bookmarks & Buttons
    • Data Binding and Power BI Report Server

    Introduction to Power BI Dashboard and Data Insights

    • Why Dashboard and Dashboard vs Reports
    • Creating Dashboards
    • Conguring a Dashboard Dashboard Tiles, Pinning Tiles
    • Power BI Q&A
    • Quick Insights in Power BI

    Direct Connectivity

    • Custom Data Gateways
    • Exploring live connections to data with Power BI
    • Connecting directly to SQL Server
    • Connectivity with CSV & Text Files
    • Excel with Power BI Connect Excel to Power BI, Power BI Publisher for Excel
    • Content packs
    • Update content packs

    Publishing and Sharing

    • Introduction and Sharing Options Overview
    • Publish from Power BI Desktop and Publish to Web
    • Share Dashboard with Power BI Service
    • Workspaces (Power BI Pro) and Content Packs (Power BI Pro)
    • Print or Save as PDF and Row Level Security (Power BI Pro)
    • Export Data from a Visualization
    • Export to PowerPoint and Sharing Options Summary

    Refreshing Datasets

    • Understanding Data Refresh
    • Personal Gateway (Power BI Pro and 64-bit Windows)
    • Replacing a Dataset and Troubleshooting Refreshing

    Introduction to Data Preparation using Tableau Prep

    • Data Visualization
    • Business Intelligence tools
    • Introduction to Tableau
    • Tableau Architecture
    • Tableau Server Architecture
    • VizQL Fundamentals
    • Introduction to Tableau Prep
    • Tableau Prep Builder User Interface
    • Data Preparation techniques using Tableau Prep Builder tool

    Data Connection with Tableau Desktop

    • Features of Tableau Desktop
    • Connect to data from File and Database
    • Types of Connections
    • Joins and Unions
    • Data Blending
    • Tableau Desktop User Interface

    Basic Visual Analytics

    • Visual Analytics
    • Basic Charts Bar Chart, Line Chart, and Pie Chart
    • Hierarchies
    • Data Granularity
    • Highlighting
    • Sorting
    • Filtering
    • Grouping
    • Sets

    Calculations in Tableau

    • Types of Calculations
    • Built-in Functions (Number, String, Date, Logical and Aggregate)
    • Operators and Syntax Conventions
    • Table Calculations
    • Level of Detail (LOD) Calculations
    • Using R within Tableau for Calculations

    Advanced Visual Analytics

    • Parameters
    • Tool tips
    • Trend lines
    • Reference lines
    • Forecasting
    • Clustering

    Level of Detail (LOD) Expressions in Tableau

    • Count Customer by Order
    • Profit per Business Day
    • Comparative Sales
    • Profit Vs Target
    • Finding the second order date
    • Cohort Analysis

    Geographic Visualizations in Tableau

    • Introduction to Geographic Visualizations
    • Manually assigning Geographical Locations
    • Types of Maps
    • Spatial Files
    • Custom Geocoding
    • Polygon Maps
    • Web Map Services
    • Background Images

    Advanced charts in Tableau

    • Box and Whisker?s Plot
    • Bullet Chart
    • Bar in Bar Chart
    • Gantt Chart
    • Waterfall Chart
    • Pareto Chart
    • Control Chart
    • Funnel Chart
    • Bump Chart
    • Step and Jump Lines
    • Word Cloud
    • Donut Chart

    Dashboards and Stories

    • Introduction to Dashboards
    • The Dashboard Interface
    • Dashboard Objects
    • Building a Dashboard
    • Dashboard Layouts and Formatting
    • Interactive Dashboards with actions
    • Designing Dashboards for devices
    • Story Points

    Get Industry Ready

    • Tableau Tips and Tricks
    • Choosing the right type of Chart
    • Format Style
    • Data Visualization best practices

    Exploring Tableau Online

    • Publishing Workbooks to Tableau Online
    • Interacting with Content on Tableau Online
    • Data Management through Tableau Catalog
    • AI-Powered features in Tableau Online (Ask Data and Explain Data)
    • Understand Scheduling
    • Managing Permissions on Tableau Online
    • Data Security with Filters in Tableau Online

    Introduction to Cloud Computing

    • In this module, you will learn what Cloud Computing is and what are the different models of Cloud Computing along with the key differentiators of different models. We will also introduce you to virtual world of AWS along with AWS key vocabulary, services and concepts.
      • A Short history
      • Client Server Computing Concepts
      • Challenges with Distributed Computing
      • Introduction to Cloud Computing
      • Why Cloud Computing
      • Benefits of Cloud Computing

    Amazon EC2 and Amazon EBS

    • In this module, you will learn about the introduction to compute offering from AWS called EC2. We will cover different instance types and Amazon AMIs. A demo on launching an AWS EC2 instance, connect with an instance and host ing a website on AWS EC2 instance. We will also cover EBS storage Architecture (AWS persistent storage) and the concepts of AMI and snapshots.
      • Amazon EC2
      • EC2 Pricing
      • EC2 Type
      • Installation of Web server and manage like (Apache/ Nginx)
      • Demo of AMI Creation
      • Exercise
      • Hands on both Linux and Windows

    Amazon Storage Services S3 (Simple Storage Services)

    • In this module, you will learn how AWS provides various kinds of scalable storage services. In this module, we will cover different storage services like S3, Glacier, Versioning, and learn how to host a static website on AWS.
      • Versioning
      • Static website
      • Policy
      • Permission
      • Cross region Replication
      • AWS-CLI
      • Life cycle
      • Classes of Storage
      • AWS CloudFront
      • Real scenario Practical
      • Hands-on all above

    Cloud Watch & SNS

    • In this module, you will learn how to monitoring AWS resources and setting up alerts and notifications for AWS resources and AWS usage billing with AWS CloudWatch and SNS.
      • Amazon Cloud Watch
      • SNS - Simple Notification Services
      • Cloud Watch with Agent

    Scaling and Load Distribution in AWS

    • In this module, you will learn about 'Scaling' and 'Load distribution techniques' in AWS. This module also includes a demo of Load distribution & Scaling your resources horizontally based on time or activity.
      • Amazon Auto Scaling
      • Auto scaling policy with real scenario based
      • Type of Load Balancer
      • Hands on with scenario based

    AWS VPC

    • In this module, you will learn introduction to Amazon Virtual Private Cloud. We will cover how you can make public and private subnet with AWS VPC. A demo on creating VPC. We will also cover overview of AWS Route 53.
      • Amazon VPC with subnets
      • Gateways
      • Route Tables
      • Subnet
      • Cross region Peering

    Identity and Access Management Techniques (IAM)

    • In this module, you will learn how to achieve distribution of access control with AWS using IAM.
    • Amazon IAM
      • add users to groups,
      • manage passwords,
      • log in with IAM-created users.
    • User
    • Group
    • Role
    • Policy

    Amazon Relational Database Service (RDS)

    • In this module, you will learn how to manage relational database service of AWS called RDS.
      • Amazon RDS
      • Type of RDS
      • RDS Failover
      • RDS Subnet
      • RDS Migration
      • Dynamo DB (No SQL DB)
      • Redshift Cluster
      • SQL workbench
      • JDBC / ODBC

    Multiple AWS Services and Managing the Resources' Lifecycle

    • In this module, you will get an overview of multiple AWS services. We will talk about how do you manage life cycle of AWS resources and follow the DevOps model in AWS. We will also talk about notification and email service of AWS along with Content Distribution Service in this module.
      • Cloud Trail,

    AWS Architecture and Design

    • In this module, you will cover various architecture and design aspects of AWS. We will also cover the cost planning and optimization techniques along with AWS security best practices, High Availability (HA) and Disaster Recovery (DR) in AWS.
      • AWS High Availability Design
      • AWS Best Practices (Cost +Security)
      • AWS Calculator & Consolidated Billing

    Migrating to Cloud & AWS

    Router S3 DNS

    • Public DNS
    • Private DNS
    • Routing policy
    • Records
    • Register DNS
    • Work with third party DNS as well

    Cloud Formation

    • Stack
    • Templet
    • Json / Ymal
      • Installation of Linux
      • Configuration
      • Manage
      • Installation of app on Linux (apache / Nginx etc)
      • AWS cli configuration on Linux
      • Complete hands-on on Linux.
      • Scenario based lab and practical
      • Each topic and services will be cover with lab and theory.

    Elastic Beanstalk

    EFS / NFS (hands-on practice)

    Hands-on practice on various Topics

    Linux

    Capstone Project

Elective Program

PowerBI

Power BI: Data Visualization & Business Intelligence

or
Tableau

Tableau: Data Visualization for Data-Driven Decisions

Azure

Azure is Microsoft’s cloud computing service platform.

or
AWS

AWS is Amazon's cloud computing service platform.

Free Quiz

Python

Python for Data Analyst

Take Exam
My SQL & SQL

My SQL & SQL Exam

Take Exam
Excel

Analytics with Excel

Take Exam
Microsoft Power BI

Microsoft Power BI

Take Exam
Tableau

Tableau

Take Exam
AWS(Amazon Web Services)

AWS

Take Exam

Course Design By

naswipro

Nasscom & Wipro

Course Offered By

croma-orange

Croma Campus

Master's Program Certificate

You will get certificate after completion of program

Tools Covered of Masters in Data Analytics

Numpy

Numpy

Python

Python

Tableau

Tableau

Power BI

Power BI

Excel

Excel

AWS

AWS

Azure

Azure

Panda

Panda

MatPlotLib

MatPlotLib

Seaborn

Seaborn

SQL

SQL

Cloud Computing

Cloud Computing

Statistics

Statistics

Msqlserver

Msqlserver

Data visualization

Data visualization

Data analytics

Data analytics

master-page-girl
Get the Best IT Training Guidance

Start your journey with the best IT
training experts in India.

green-gowth

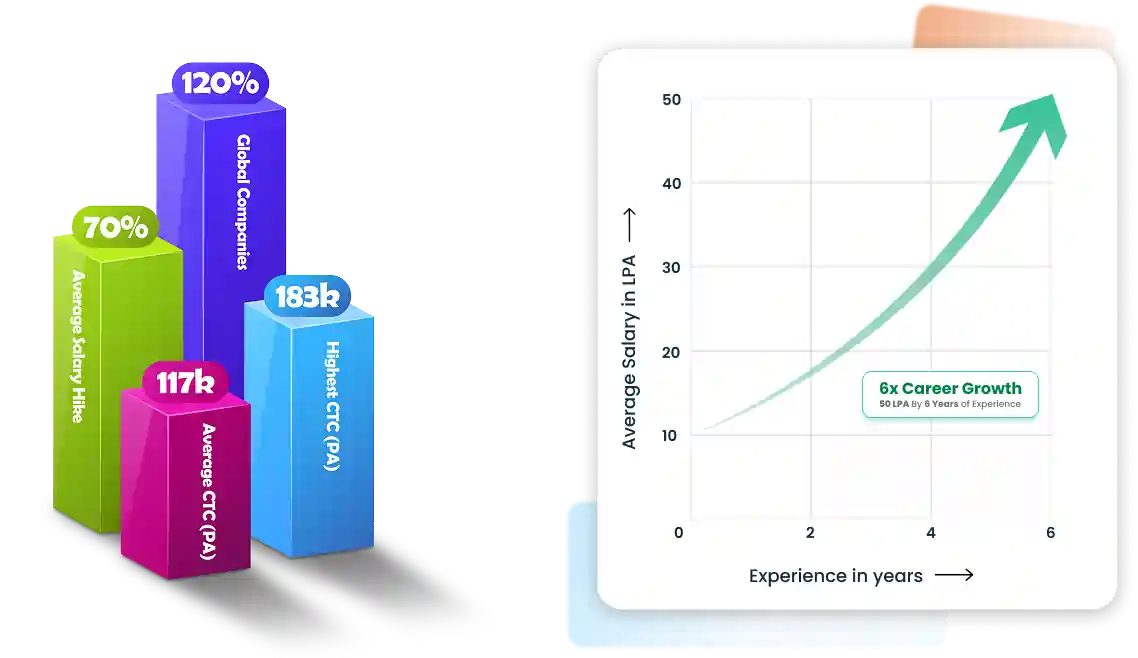
50% Average Salary Hike

banner

Masters in Data Analytics

4.9 out of 5 rating vote 9563

Master the fundamentals of data analytics and learn how to use it for retrieval of business insights..

INR 80000 + GST
100% Placement Assistance

Success Speaks

Meet Our
Placed Students!

Watch Testimonial
Ravinder Singh

Course : Data Analyst

Kajal

Course : Data Analyst

Pragati Seth

Course : Data Analytics

Sandeep

Course : Data Analytics

Watch Testimonial
Get exclusive
access to career resources
upon completion
Mock Session

You will get certificate after
completion of program

LMS Learning

You will get certificate after
completion of program

Career Support

You will get certificate after
completion of program

User Image

Ranvijay

Cloud Computing

User Image

Here is My Story

Watch Now

Non-Tech to Tech Role

Got it! Could you let me know the topic or purpose of the content you want? For example: a caption, a story intro, something motivational, a business blurb, etc.? Once I know that, I’ll craft the 40-word content for you.

Logo 1 Logo 2
User Image

Uddeshya Sonkar

Python

User Image

Here is My Story

Watch Now

Non-Tech to Tech Role

I had an outstanding experience with AbGyan. The counselors were very supportive and they guided me at each step of the admission process. I had an outstanding experience with AbGyan. The counselors were very supportive and they guided me at each step of the admission process. Readmore

Logo 1 Logo 2

Download Curriculum

Get a peek through the entire curriculum designed that ensures Placement Guidance

Course Design By

Course Offered By

Masters in Data Analytics Projects

Domain: Domain: Cricket Sports

Project Name

IPL Data Analysis:

Indian Premier League more popularly called IPL is a Cricket Tournament hoisted by the Cricket Board of India(BCCI). Players from different countries participate in IPL making it an exciting opportunity to entertain cricket lovers. IPL was established in 2008 when the first season of IPL was hoisted. We perform the EDA task to find the insights in data of a highest scorer player in the Indian team.

Tools & Technology Used:

Domain: Domain: Fitness and Health

Project Name:

Calories Burnt Prediction:

The Calories Burnt Prediction project aims to develop an advanced machine learning model that can accurately predict the number of calories an individual burns based on various physiological and activity-related factors. This project has significant applications in the fields of health and fitness, personalized training programs, weight management, and overall wellness.

Tools & Technology Used:

Domain: Domain: HR

Project Name:

Hiring Process Analytics:

Hiring process is the fundamental and the most important function of a company. Here, the MNCs get to know about the major underlying trends about the hiring process. Trends such as- number of rejections, number of interviews, types of jobs, vacancies etc. are important for a company to analyse before hiring freshers or any other individual.

Tools & Technology Used:

Industry Insights

*Insights Displayed Are as Per Our Recorded Data

Be The Bedrock Of The Company!

Job Target Roles

Data Analyst ₹5L - ₹8L

Business Analyst ₹6L - ₹10L

Data Engineer ₹7L - ₹14L

SQL Developer ₹5L - ₹9L

Risk Analyst ₹6L - ₹9L

Marketing Analyst ₹5L - ₹9L

Operations Analyst ₹5L - ₹8L

Financial Analyst ₹6L - ₹10L

Product Analyst ₹7L - ₹12L

Research Analyst ₹4L - ₹7L

Insights Analyst ₹6L - ₹10L

Fraud Analyst ₹5L - ₹9L

Reporting Analyst ₹5L - ₹8L

Healthcare Analyst ₹6L - ₹10L

Compliance Analyst ₹5L - ₹9L

Systems Analyst ₹6L - ₹11L

Tableau Developer ₹6L - ₹12L

PowerBI Developer ₹6L - ₹11L

AI Analyst ₹8L - ₹15L

Data Architect ₹15L - ₹25L

Analytics Consultant ₹9L - ₹16L

Analytics Consultant ₹9L - ₹16L

Data Architect ₹15L - ₹25L

AI Analyst ₹8L - ₹15L

PowerBI Developer ₹6L - ₹11L

Tableau Developer ₹6L - ₹12L

Systems Analyst ₹6L - ₹11L

Compliance Analyst ₹5L - ₹9L

Healthcare Analyst ₹6L - ₹10L

Reporting Analyst ₹5L - ₹8L

Fraud Analyst ₹5L - ₹9L

Insights Analyst ₹6L - ₹10L

Research Analyst ₹4L - ₹7L

Product Analyst ₹7L - ₹12L

Financial Analyst ₹6L - ₹10L

Operations Analyst ₹5L - ₹8L

Marketing Analyst ₹5L - ₹9L

Risk Analyst ₹6L - ₹9L

SQL Developer ₹5L - ₹9L

Data Engineer ₹7L - ₹14L

Business Analyst ₹6L - ₹10L

Data Analyst ₹5L - ₹8L

Top Recruiters

View More Recruiters

Get Ahead with Croma Campus Master Certificate

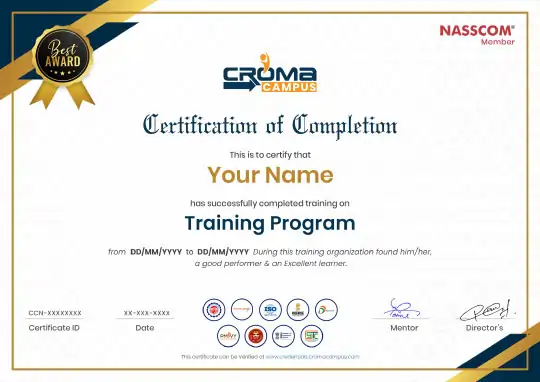
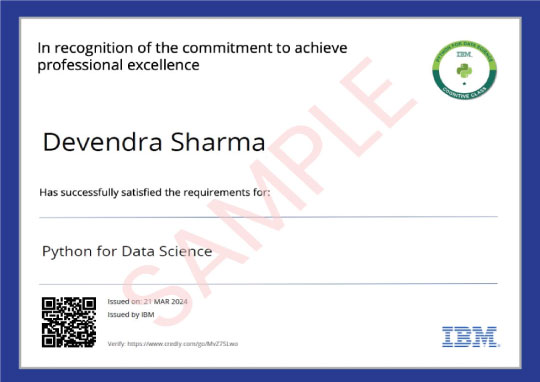
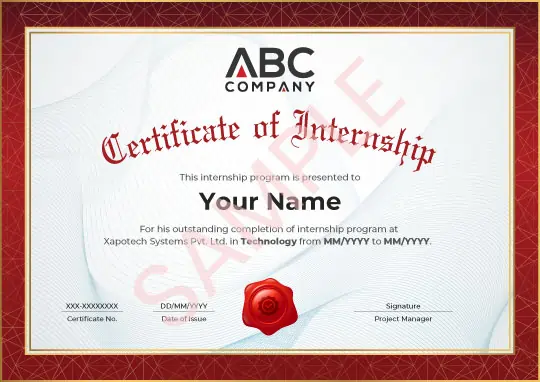
*Image for illustration only. Certificate subject to change.

  • Earn Your Certificate

Our Master program is exhaustive and this certificate is proof that you have taken a big leap in mastering the domain.

  • Differentiate yourself with a Masters Certificate

The knowledge and skill you've gained working on projects, simulation, case studies will set you ahead of competition.

  • Share Your Achievement

Talk about it on Linkedin, Twitter, Facebook, boost your resume or frame it- tell your friend and colleagues about it.

Students Placements & Reviews

speaker
Vikash Singh Rana
Vikash Singh Rana
speaker
Vikash Singh Rana
Shubham Singh
speaker
Vikash Singh Rana
Saurav Kumar
View More

Self Assessment

TAKE A FREE EXAM

Encourages Discipline & Consistency

Assess Knowledge & Understanding

Enhance Learning & Retention

Develops Time Management

Boosts Confidence

Neha Kumari

Web Designer

Got Certificate

Laxman Sharma

Web Developer

Got Certificate

Diksha Rai

Web Designer

Got Certificate

Ayushi Mehra

Graphic Designer

Got Certificate

Ishani Rawat

Software Testing

Got Certificate

Akansha Sharma

Automation Testing

Got Certificate
FOR QUERIES, FEEDBACK OR ASSISTANCE

Contact Croma Campus Learner Support

Best of support with us

The data analytics training program will help you gain in detail knowledge of vital data analytics technologies. Moreover, the course will help you master the skills that are necessary to become a confident data analyst. For example, you will master skills like Tableau, R, Python, SQL, etc. The main aim of this training program is to help students develop skills that are essential for marketing themselves as skilled data analytics professionals. After going through this course, you can get a job as a:

  • Junior Data Analyst
  • Junior Data Scientist
  • Finance Analyst
  • Business Intelligence Analyst
  • Data Engineer
certificate

There are lots of excellent opportunities from which you can choose after completing the data analytics training program. This is because today, a large number of organizations and government agencies rely upon data analytics to improve their company's performance. As a result, today, every organization is searching for data experts such as data scientists, data engineers, etc. that can help them transform their data into powerful business insights. Thus, pursuing your career in the data analytics industry can be very beneficial for you.

  • Web IconAccording to a survey of IBM, the number of data analyst jobs in the United States of America will cross the mark of 2,720,000 in the upcoming years.
  • BrainAmple of excellent opportunities are available for students who pursue their careers in the data analytics industry. For example, you can get a job as a data analyst, data scientist, etc.
  • PolygonAs per a survey, most of the companies, by the year 2023, will start storing their data for analysis in the public cloud warehouses.
  • AnalyticsAs per a survey, the data analytics market is expected to grow with a compound annual growth rate of 25% till the year 2030.

The popularity of data analytics is growing with every passing day. This course will help you gain in detail knowledge of vital data analytics technologies. Furthermore, the main aim of the training program is to help students become familiar with the advantages of using data analytics.

GrowthWith project-based training and lots of quizzes and assignments, you will gain the knowledge and skills that are essential for getting placed as an analyst in a reputed company.

AnalyticsAfter completing the data analytics training program, you can easily get placed in a respected company or firm with handsome remuneration of ₹ 3,00,000-₹12,00,000.

StructureAs per a survey, 2,720,000 job opportunities will be created in the data analytics industry in the upcoming years.

The main aim of the data analytics training program is to make students familiar with all the concepts of data analytics and various tools used for performing data analytics. Besides this, you will learn to use data analytics to help a firm grow and improve its performance and profits.
Things you will learn:

  • Data fundamentals
  • How to work with different data tools?
  • Importance of data analytics
  • Data analysis

The objective of this data analytics course is to give students quality data analytics training to students and make them experts in working with different data analytics technologies. The course is developed in partnership with data experts and keeping in mind the changing demands of the data analytics industry.

×

For Voice Call

+91-971 152 6942

For Whatsapp Call & Chat

+91-9711526942
1

Ask For
DEMO