


.webp)
.png)
.png)
.png)
.png)
.png)
.png)
.png)
.png)
.png)
.png)
.png)
.png)


Course Design By
Nasscom & Wipro
Data science jobs are rapidly growing in demand.
Data Scientist is a domain that assists with solving complex and puzzling issues through data by collecting and analyzing the perfect solutions extracted using modern tools and techniques.
Program Designed By


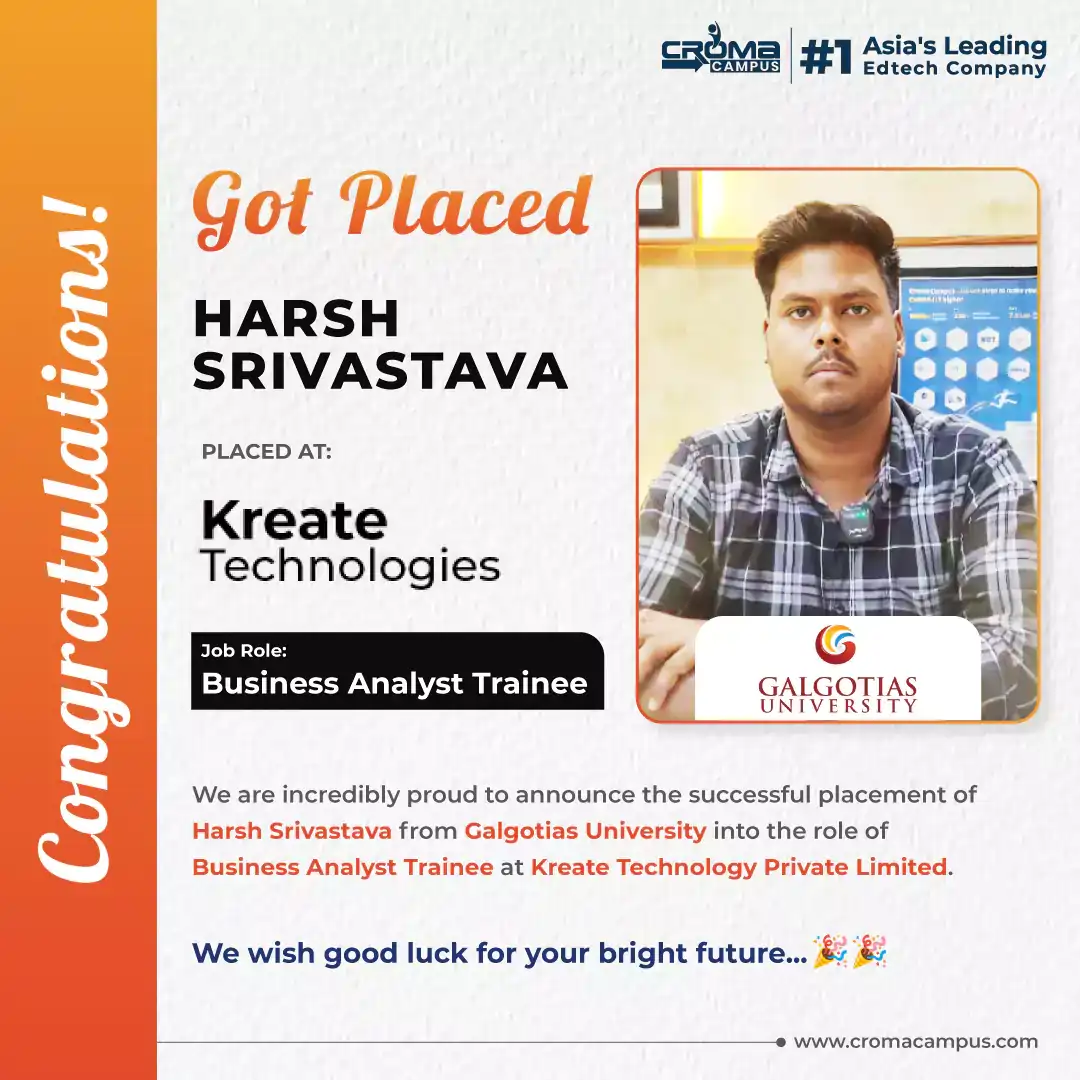
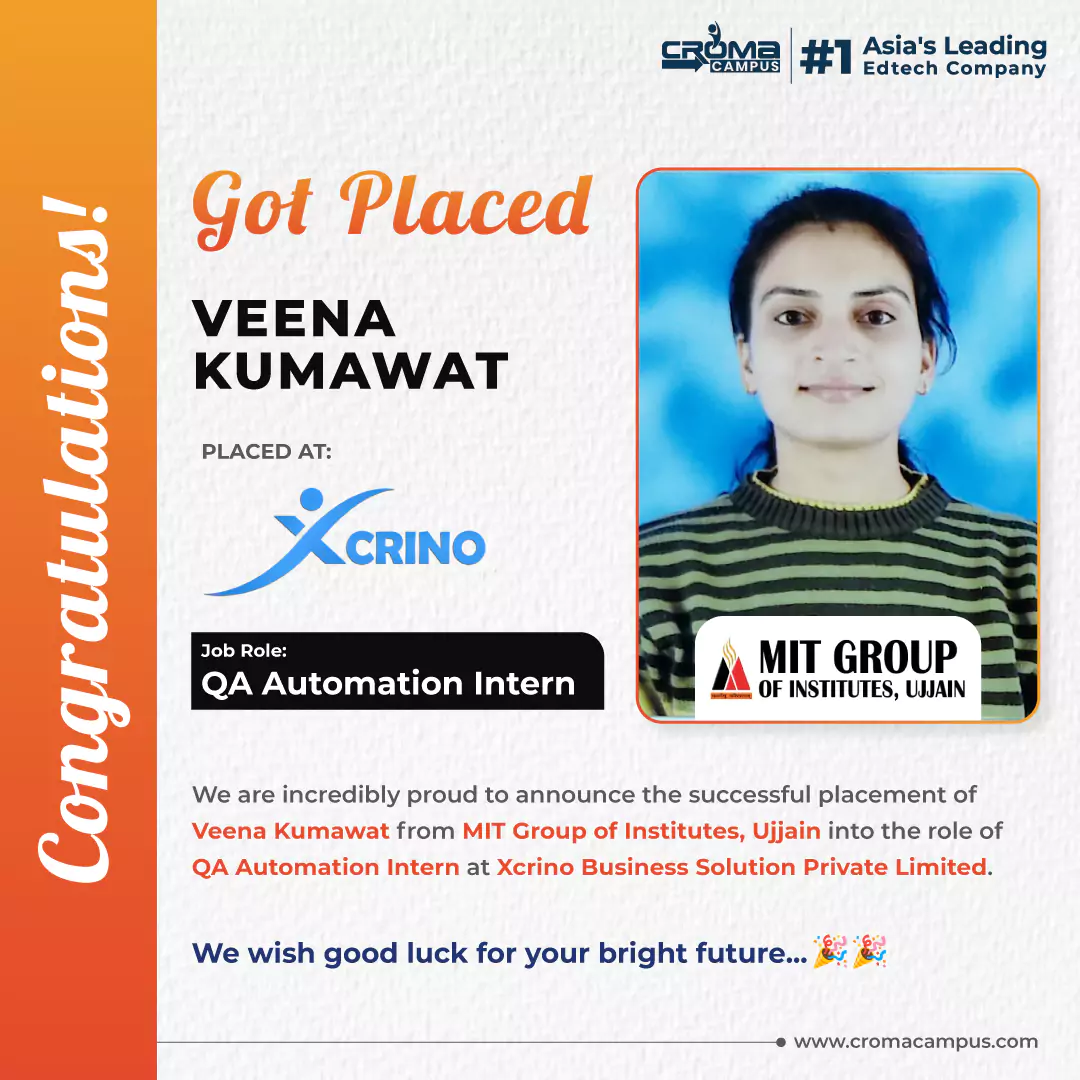
Croma Campus alumni work at top companies


INR 7,000*
Per Month
Starting at
Register Now
And Get
10%
OFF
Limited Time Offer*
Introduction To Python
Python Keyword and Identiers
Introduction To Variables
Python Data Type
Control Structure & Flow
List
Tuple
Dictionary
Sets
Strings
Python Function, Modules and Packages
Decorator, Generator and Iterator
Python Exception Handling
Python File Handling
Memory management using python
Python Database Interaction
Reading an excel
Complete Understanding of OS Module of Python
Data Analysis and Visualization using Pandas.
Data Analysis and Visualization using NumPy and MatPlotLib
Introduction to Data Visualization with Seaborn
Introduction to Statistics
EDA (Exploratory Data Analysis)
Data Pre-Processing & Data Mining
Introduction to Predictive Modelling
SQL Server Fundamentals
SQL Server 2019 Database Design
SQL Tables in MS SQL Server
Data Validation and Constraints
Views and Row Data Security
Indexes and Query tuning
Stored Procedures and Benets
System functions and Usage
Triggers, cursors, memory limitations
Cursors and Memory Limitations
Transactions Management
Understanding Concepts of Excel
Ms Excel Advance
MIS Reporting & Dash Board
What is Macro
Recording a Macro
Different Components of a Macro
What is VBA and how to write macros in VBA.
Introduction to Power BI
Power BI Desktop
Power BI Data Transformation
Modelling with Power BI
Data Analysis Expressions (DAX)
Power BI Desktop Visualisations
Introduction to Power BI Dashboard and Data Insights
Direct Connectivity
Publishing and Sharing
Refreshing Datasets
Introduction to Data Preparation using Tableau Prep
Data Connection with Tableau Desktop
Basic Visual Analytics
Calculations in Tableau
Advanced Visual Analytics
Level of Detail (LOD) Expressions in Tableau
Geographic Visualizations in Tableau
Advanced charts in Tableau
Dashboards and Stories
Get Industry Ready
Exploring Tableau Online
Introduction to Machine Learning
Time Series Analysis
Statistical Foundations (Self-Paced)
Introduction to Text Mining and NLP
Introduction to Deep Learning
Deep Learning Networks
Introduction to Cloud Computing
Amazon EC2 and Amazon EBS
Amazon Storage Services S3 (Simple Storage Services)
Cloud Watch & SNS
Scaling and Load Distribution in AWS
AWS VPC
Identity and Access Management Techniques (IAM)
Amazon Relational Database Service (RDS)
Multiple AWS Services and Managing the Resources' Lifecycle
AWS Architecture and Design
Migrating to Cloud & AWS
Router S3 DNS
Cloud Formation
Elastic Beanstalk
EFS / NFS (hands-on practice)
Hands-on practice on various Topics
Linux
Capstone Project

Power BI: Data Visualization & Business Intelligence

Tableau: Data Visualization for Data-Driven Decisions

Azure is Microsoft’s cloud computing service platform.

AWS is Amazon's cloud computing service platform.
Course Design By

Nasscom & Wipro
Course Offered By

Croma Campus
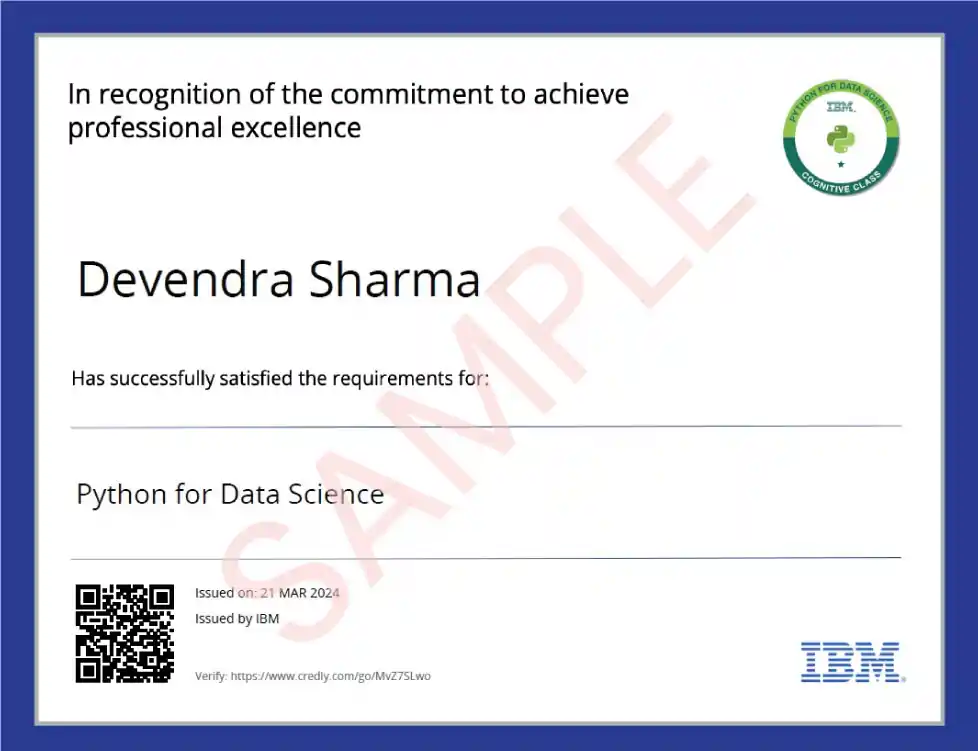
You will get certificate after completion of program
.png)
Numpy

Python
.png)
Tableau
.png)
Power BI

Start your journey with the best IT
training experts in India.

50% Average Salary Hike
Data Scientist is a domain that assists with solving complex and puzzling issues through data by collecting and analyzing the perfect solutions extracted using modern tools and techniques..

Course : Data Science


Course : Data Science


Course : Data Science


Course : AI


You will get certificate after
completion of program

You will get certificate after
completion of program

You will get certificate after
completion of program
 Non-Tech to Tech Role
Got it! Could you let me know the topic or purpose of the content you want? For example: a caption, a story intro, something motivational, a business blurb, etc.? Once I know that, I’ll craft the 40-word content for you.

 Non-Tech to Tech Role
I had an outstanding experience with AbGyan. The counselors were very supportive and they guided me at each step of the admission process. I had an outstanding experience with AbGyan. The counselors were very supportive and they guided me at each step of the admission process. Readmore

Get a peek through the entire curriculum designed that ensures Placement Guidance
Course Design By


Course Offered By
Domain: Domain: Cricket Sports

Project Name:
Indian Premier League more popularly called IPL is a Cricket Tournament hoisted by the Cricket Board of India(BCCI). Players from different countries participate in IPL making it an exciting opportunity to entertain cricket lovers. IPL was established in 2008 when the first season of IPL was hoisted. We perform the EDA task to find the insights in data of a highest scorer player in the Indian team.
Tools & Technology Used:
Domain: Domain: E-Commerce

Project Name:
Business model Customer to Customer (C2C) allows customers to do business with each other. This model is growing fast with e-commerce platforms where sellers may be required to pay some amount and buyer can buy it without paying anything. E-Commerce website brings the seller and buyer to the same platform.
Tools & Technology Used:
Domain: Domain: Automobile

Project Name:
Predicting used car prices helps buyers and sellers make better decisions. Many people engage in the used car market to buy or sell vehicles. This project uses features like price, mileage, fuel type, and year to estimate a car’s market value, avoiding overpaying or underselling.
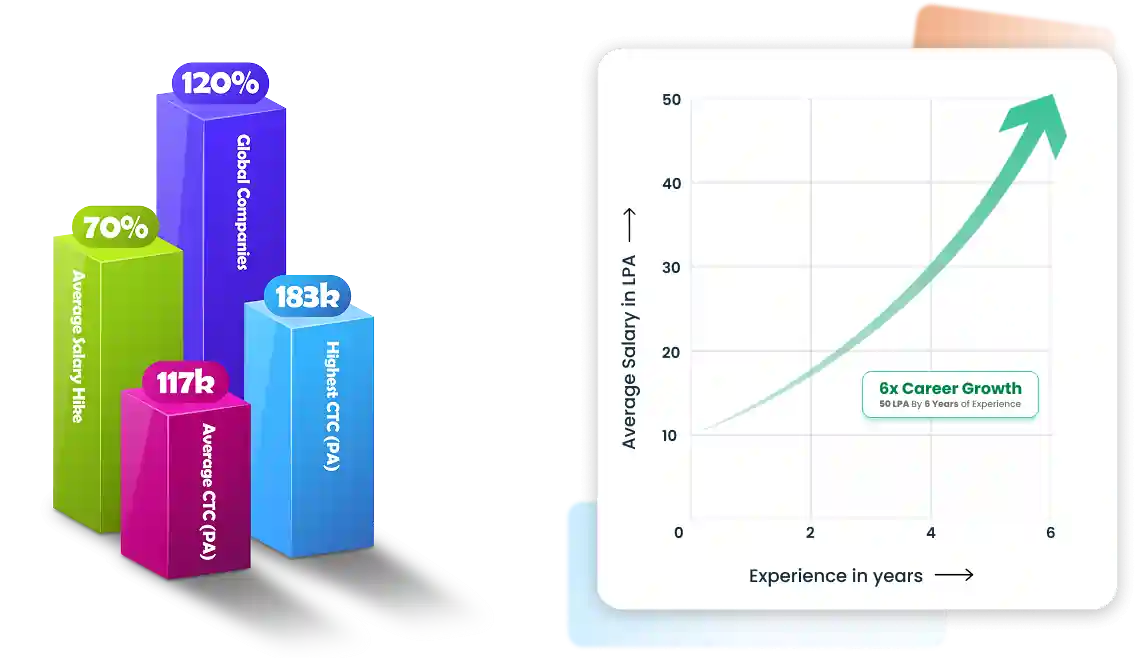
*Insights Displayed Are as Per Our Recorded Data
Data Scientist ₹8L - ₹25L
Data Analyst ₹5L - ₹12L
Business Analyst ₹6L - ₹14L
Data Engineer ₹8L - ₹20L
AI Engineer ₹10L - ₹20L
Big Data Engineer ₹9L - ₹22L
Research ₹12L - ₹30L
Decision Scientist ₹8L - ₹18L
Data Consultant ₹8L - ₹10L
Insights Analyst ₹6L - ₹12L
Cloud Architect ₹15L - ₹25L
NLP Engineer ₹10L - ₹25L
Risk Analyst ₹6L - ₹14L
Fraud Analyst ₹5L - ₹12L
ETL Developer ₹6L - ₹14L
Data Manager ₹12L - ₹25L
Model Validator ₹10L - ₹20L
AI Researcher ₹12L - ₹28L
Product Analyst ₹7L - ₹15L
Product Analyst ₹₹6L - ₹₹12L
Product Analyst ₹₹6L - ₹₹12L
Product Analyst ₹7L - ₹15L
AI Researcher ₹12L - ₹28L
Model Validator ₹10L - ₹20L
Data Manager ₹12L - ₹25L
ETL Developer ₹6L - ₹14L
Fraud Analyst ₹5L - ₹12L
Risk Analyst ₹6L - ₹14L
NLP Engineer ₹10L - ₹25L
Cloud Architect ₹15L - ₹25L
Insights Analyst ₹6L - ₹12L
Data Consultant ₹8L - ₹10L
Decision Scientist ₹8L - ₹18L
Research ₹12L - ₹30L
Big Data Engineer ₹9L - ₹22L
AI Engineer ₹10L - ₹20L
Data Engineer ₹8L - ₹20L
Business Analyst ₹6L - ₹14L
Data Analyst ₹5L - ₹12L
Data Scientist ₹8L - ₹25L
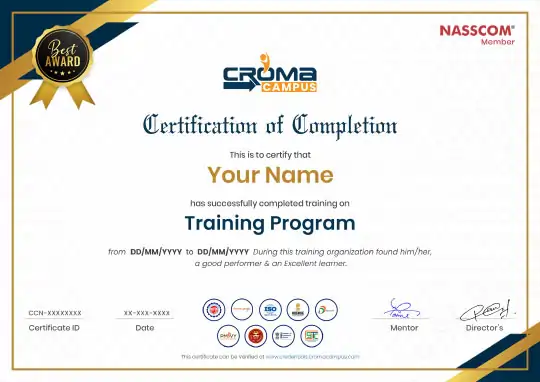
*Image for illustration only. Certificate subject to change.
Our Master program is exhaustive and this certificate is proof that you have taken a big leap in mastering the domain.
The knowledge and skill you've gained working on projects, simulation, case studies will set you ahead of competition.
Talk about it on Linkedin, Twitter, Facebook, boost your resume or frame it- tell your friend and colleagues about it.
.webp)
Total Exam Submitted
Best of support with us
The data science training includes a combination of multiple domains including scientific method, artificial intelligence, statistics, and data analysis. All these combined help in extracting the data to understand the changes to integrate the perfect business process. The Data Science program offers complete industry mentorship covering 6 specializations with a blend of tools, analytics, machine learning, and business acumen. The program is dedicated to providing complete career support providing hands-on experience over 14 programming tools.

Opportunities in data science are growing more and more making it a very lucrative option with less competition. Data science is declared as the most trending job in the 21st century and is in great demand for the domains covering finance, marketing, retail, FMCG, and many others. With such high demand, the career possibilities in data science see astonishing growth in the coming future.
Data science is getting more popular course day by day. The training will help you to easily understand the use of big data using coding and algorithms. The main motive of the course is intended to derive problem-solving solutions for the business.
![]() With 60+ industry projects and 14+ programming languages and tools, this training provides you the eligibility to enter the top organizations.
With 60+ industry projects and 14+ programming languages and tools, this training provides you the eligibility to enter the top organizations.
![]() The average entry-level salary after completing the training is around 6 LPA and an experienced data scientist with 1 to 4 years of experience earns 10 LPA.
The average entry-level salary after completing the training is around 6 LPA and an experienced data scientist with 1 to 4 years of experience earns 10 LPA.
![]() According to the US Bureau of labor statistics, there is a 27.9% rise in employment with the average growth estimated at 14% growth through 2028
According to the US Bureau of labor statistics, there is a 27.9% rise in employment with the average growth estimated at 14% growth through 2028
The vision is intended to provide aspirants proper knowledge to understand the current need for data science and its integration with other technologies. You will understand the procedures to align the outcomes and easily identify the challenges and objectives for achieving business goals.
The main objective of getting trained in data science is to develop useful and precise knowledge, skills, and techniques. The training is a completely task-oriented activity that is designed to improve the performance in your current job roles and prepare you for future jobs.


Download To Course Content
Share some of your details and we will be in touch with you for demo details, and know about Batches Available with us!
By registering here, I agree to Croma Campus Terms & Conditions and Privacy Policy

For Voice Call
+91-971 152 6942For Whatsapp Call & Chat
+91-9711526942
Ask For
DEMO
Share some of your details and we will be in touch with you for demo details, and know about Batches Available with us!


 Master in Cloud Computing Training